
Nursery Rhymes are a function for what? As a parent of four children I can attest that when the kids were much younger, those little jingles were an important part of our nightly routine of lulling them to sleep. Now back to me, where the constant chatter around the Fed easing rates is more of a siren song about the potential danger to exposing one’s portfolio to too much risk, however as US stock indices levitate ever higher, to the vast majority of participants the rise in stock prices appears to be a nursery rhyme. Investing is a sport in probabilities. There are no certainties. Randomness and irrationality play a large part in securities pricing. So does luck. Pretending that only fundamentals matter more than psychology is a big mistake. Similarly, parroting some random market-socialist theories in Money magazine that “you can’t time the market,” so you should just buy and hold some index fund is probably a worse mistake. In my mind, successful investing is about situational awareness. Sometimes it is “three yards and a cloud of dust,” and other times you “air it out” into the end zone. The point is, that as a financial quarterback, it is my job to read the defense and to run plays that have the highest chance to advance the ball down the field. Let’s take a look at how I am currently reading the defense. Oh, and punting is an important part to the game of investing!
Anyone who has run a business or even raised kids should relate to the cartoon above. A couple of popular quotes come to mind, but I think the quote that is most germane comes from the investment guru Mike Tyson. Yes, the boxer. He stated that “everyone has a plan…until they get punched in the face.” Now your traditional Humongous Bank and Brokerage (HBB) sales person is notoriously bullish all the time. It is always a good time to invest because their job is to raise assets. There is always a product that is promoted that captures the essence of sentiment to get you to buy something. It has two buns; one baked with vague statements about valuation with the other bun baked with something about consensus packed in the middle with endless talk of strategy based on convoluted theories that seldom hold up in practice. Somehow eating this sandwich leaves me empty inside and most likely your brokerage statement too.
The key to keeping our portfolios to resemble the “plan” (albeit impossible to do) and a lot less like everyone else’s “reality” is to take a mosaic approach to risk by measuring the relationship of both fundamentals and price. Franklin Trend Management uses a three pronged approach when reviewing data. We first view the current landscape through the prism of history, not consensus. You’ll never make out-sized returns by investing with consensus. By the very nature of success your portfolio has took look different than what everyone else is doing at the cycle turn or whatever HBB sandwich they are serving for lunch that day. We like math. Our second leg involves math. Not crazy math, but the figures need to add up and make sense. The last leg is built around investor behavior. Psychology plays one of the biggest parts of your investment success. Do you have an investment discipline based on history and math? Do you have the emotional tolerance to “zig” when everyone else is screaming you need to “zag.” Especially when your idiot brother-in-law is “zagging” and you see all the money he is making. Can you steadfastly “zig?” This is what I will try to get you to think about throughout this missive.
The economy is cyclical. To most people this is kind of a “duh” statement. But when I talk to individual investors, it becomes apparent that while most acknowledge cyclicality, they still don’t truly believe that a cyclic downturn would negatively affect their net worth. Or that somehow cycle downturns come out of left field, so what is the point of evening trying to monitor? Or worse, they actually think their “advisor” is doing this for them. I can say with first hand experience, after working in two of the largest brokerage firms in the county, that would be a very bad assumption that your advisor is measuring and mapping the global data daily to protect your account in the case a financial downturn. The economy does not operate like how I hit 300 yard drives down the middle of the fairway. Now that comes out of left field! The truth is that the economy can be measured and monitored. If one takes a probabilistic approach to data and outcomes, many would experience brokerage account statements that look more like the “plan” and less of the “reality.”
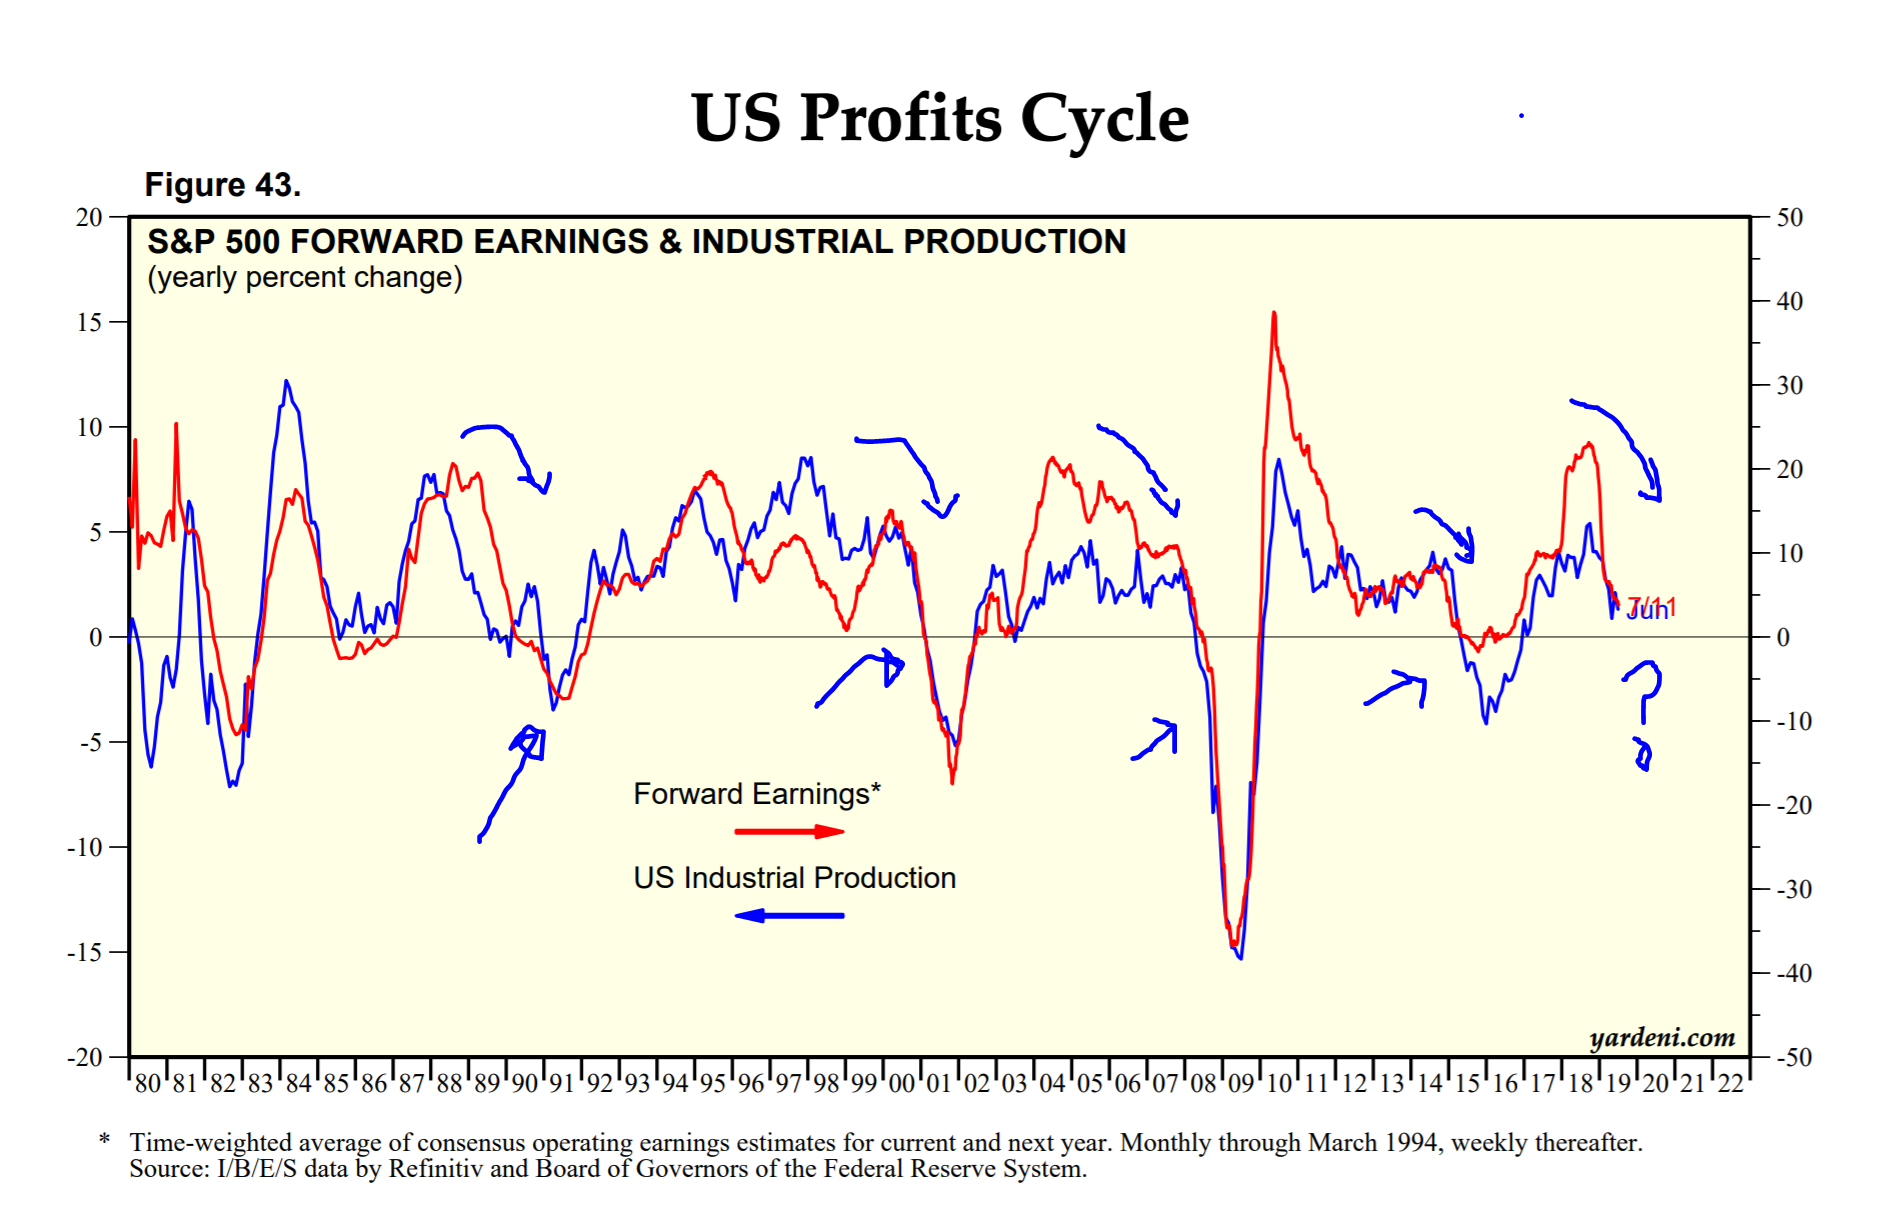
Stock prices are driven by two things: the anticipation of earnings and the surprise of earnings. Long-term growth of a company’s market capitalization is driven by long-term earnings growth. If we refer back to the chart above, one can see that there is a high degree (not perfect) of correlation of the rate of change in S&P 500 earnings and the rate of change in industrial production. You can then use this relationship to identify the certain sections of the stock market or other asset classes with the greatest probability of success.

Above is a graph that monitors the global Purchasing Managers Indexes (PMIs). What is this and why do professional risk managers care about it? The PMI data are the result of surveying over 26,000 purchasing mangers on a monthly basis about the health of business. It is one of several good leading indicators about the future of economic conditions. Just to get on the same page, an upward sloping line is good and a downward sloping line is bad. When the line is above 50 that is good and below 50 is bad.
This graphic illustrates that the global economy peaked in the first quarter of 2018 (we can compare this to the EAFE index at the end) and has been decelerating ever since. Over time, assets get priced on the basis of fundamentals getting better or getting worse. Assets don’t get priced on that every day, but over a reasonable period of time (6 to 18 months) price will reflect that “better or worse” data. If price will eventually respond positively or negatively to the rate of change in fundamental business conditions, i.e. industrial production, PMIs, etc., then how do you think prudent risk managers should be acting right now? Maybe revisit the “plan” vs. “reality” cartoon for some guidance if you are unsure.

One of the most important lessons I’ve learned over the years is to never use a single source when drawing conclusions. It usually benefits me to take a more mosaic approach to decision making. The whole market can stay irrational longer than you can stay solvent thing comes to mind. It is my playbook to make investment decisions when both the fundamental data and the price are aligned.
The problem with a lot of what I hear about “investing” is totally wrong. It is like that game when you all get in a circle and one person whispers one thing to another and that person attempts to whisper what they were just told to the next and so on and so on. Inevitably, by the time that last person repeats to the group what the first person said, the statement may contain an original word or two, but the bulk of the phrase is completely wrong. That is a lot of what “investing” is. Most people “remember” the stock market peaked in 1999 and crashed in 2000. If we look at the graph of the “stock market” above, you will see that the peak was in March of 2000, moved trend-less for most of 2000 with a re-test of the high in September of 2000. Stock prices then began to anticipate poor economic conditions we were facing in late 2001 and 2002. I would say this was a pretty garden variety type of move. This is the real history. I was there. I was running money during the run-up in the late 90’s and subsequent slowdown in the early 2000’s.

Now let’s reference the same index from our 2000 - 2001 example and compare this to today. We had an initial top in January 2018 and subsequent double top in October 2018. The stock prices began to discount the future slowdown in economic growth with a significant decline in October through December. But then a funny thing happened - the market did an about face on the mere hint of the Fed pausing its rate hiking stance. Again, stocks prices move in either the anticipation of or the surprise of earnings growth. Long-term, positive changes in stock prices are not backed by the jawboning of the price of money. It is hard to make a case for robust corporate profits. A persistent rise in the US dollar and wages will undoubtedly put pressure on corporate margins. Companies can only make up the deficit in contracting margins by selling more stuff to increase net income. With the rate of change in GDP decelerating, again, it is really hard to make the case for selling more stuff. So we are at odds - right? We fail our two-part test. Prices look positive (hint: they always do at tops) but our fundamental data is deteriorating. So we wait. We wait for one of two things to happen. Either the fundamental data begins to show improvement, which would signal we would be in the early innings of a new bull run and we can then begin buying risk assets. Or price begins to decline meaningfully and our existing defensive positions improve and we begin to selectively add into risk averse assets as most other’s experience “the reality” whereby we should experience something that resembles “the plan.”

Our last graph is what the “real world” looks like. This is an image of the price history of the Europe, Australasia, and Far East (EAFE) stocks. It is designed to measure what equity prices are doing around the world. I’d characterize the price action of the EAFE resembling typical stock market behavior when compared to 2000-2001 economic conditions. Granted, there is the same topping action in January 2018, but no double top later in the year. Remember, history rhymes, it never repeats exactly. What we do know is that the EAFE is behaving in concert with the Global PMI data presented earlier. At best, one can only say that this is a rally in a downtrend. I hope that even someone without “trend management” in their name can see this! What do astute investors do in a rally in a down trend with deteriorating fundamental data? Yup. You sell into the rally. Until the rate of change in the fundamental data begins to show acceleration, price rallies will most likely be sold into or shorted.
To wrap this up, we have an investment game plan. Traditional financial planners present this like our bike riding cartoon person at the begging of this missive. HBB sales people and planner’s main selling pitch to customers is to focus on the end game and forget about everything in the middle. I know this because I heard it from people in my industry for 25 years. Here’s a little clue to life and investing, IT’S NOT THE DESTINATION THAT COUNTS! THE JOURNEY IS WHAT MATTERS MOST. If you “f-up” the journey, the destination doesn’t matter. You’ll never get there - no matter how many pie charts or Monte Carlo analysis presentations you see. Now my journey doesn’t involve 8% to 10% returns over time, while subjecting my hard-eared capital to 50% - 70% draw downs in my account. You’re not putting the risk-reward relationship in your favor. The key to successful investing is to capitalize on this. It requires one to THINK! From my perch, equity investors have little edge right now. Unless the fundamental data does a complete u-turn, equity indexes like the S&P 500 are subject to significant (and swift) drops. Do I know for a fact that this is going to happen? No. It is a high probability that it happens. In Texas Hold’em poker, a pair of Aces (the highest hand you can begin with), will still lose 20% of the time. Patience in missing out on some of the upside is an important part of the successful investing. You’re being patient for the mismatch in data and price to reconcile one direction or another. Remember it is the second mouse that gets the cheese!
Looking three times before crossing the road,
P. Franklin, Jr., CEO
All opinions and estimates included in this communication constitute the author’s judgment as of the date of this report and are subject to change without notice. This communication is for informational purposes only. It is not intended as an offer or solicitation with respect to the purchase or sale of any security. This information is subject to change at any time, based on market and other conditions. Any forward looking statements are just opinions – not a statement of fact.
Investing may involve risk including loss of principal. Investment returns, particularly over shorter time periods are highly dependent on trends in the various investment markets. Past performance does not guarantee future results.